Deer Movement Forecast by ZIP: Best Hunting Times
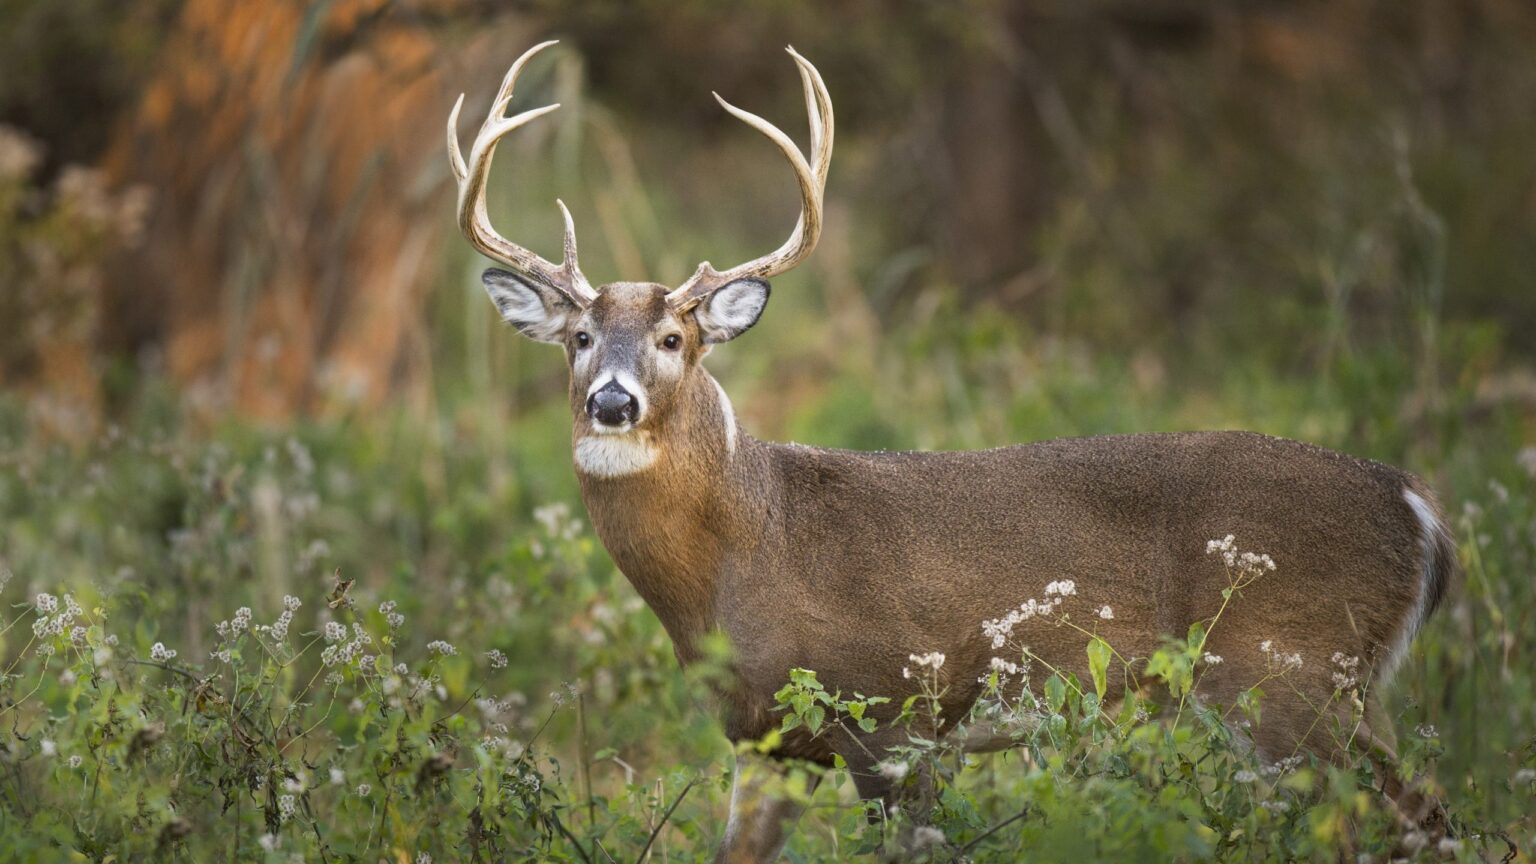
This deer movement forecast is built on GPS-collar research and your state agency’s published breeding dates rather than on moon phase alone.
Last updated: September 16, 2026 · Originally published September 15, 2026
Where and when whitetails actually move — built on GPS-collar research and your state wildlife agency’s published breeding dates, not on the moon. Enter a ZIP code and a date. The tool computes real sunrise, sunset, civil twilight, moonrise, moonset and moon transit times for your exact coordinates, works out where you sit in your state’s published rut chronology, and scores every hour of the day. The number worth quoting: GPS collars measured the difference between a full moon and a new moon at under 20 feet per hour — about two deer body lengths — while the rut raises buck movement by 140 yards per hour. The rut is roughly twenty times the moon.
Hourly movement index for the selected date. 100 is a peak-rut dawn at this latitude. Bars are shaded by the same value, and every bar carries its hour and index on touch or hover — color is never the only signal.
Light and moon times for this date
Next seven days
| Date | Best morning | Best evening | Peak index | Rut position |
|---|
Want more of this? A short daily brief for hunters and anglers. The forecast is on screen either way — nothing here is gated.
A short daily brief for hunters and anglers, and we will tell you when your region is coming up on its published peak. Unsubscribe in one click.
Data updated August 2026. Breeding dates come from state wildlife agency publications and peer-reviewed studies, listed with their source and data years in the table below. Sun and moon times are computed in your browser from standard astronomical algorithms and were checked against US Naval Observatory published times for four locations and dates — every event matched to the minute.
What a deer movement forecast can actually predict
Strip away the folklore and the published research leaves two signals that beat noise: time of day and where you are in your herd’s breeding chronology. Everything else that gets sold as a forecast — moon phase, moon position, barometric pressure, cold fronts — either failed when it was tested against GPS collars or was never tested at all.
Two measured numbers set the scale. Mississippi State’s Deer Lab put 48 GPS collars on bucks at fifteen-minute intervals for two years: at the peak of the rut, daytime bedding dropped from 34% to 22% and movement rose from 269 to 409 yards per hour. Penn State’s Deer-Forest Study collared adult does at hourly intervals across three state forests and compared new moon to full moon: the difference was under 20 feet per hour. Dr. Duane Diefenbach’s summary was blunt — “basically no difference. Just a couple of body lengths.” Meanwhile 83% of 1,439 hunters surveyed by Mississippi State believed the moon drives deer movement, and expected 50 to 200 extra yards per hour from it.
So this tool computes the moon precisely — because you will want to see it — and then tells you honestly what the research says it is worth. The score is built from time of day and rut position only.
Peak breeding dates by state, with sources
These are the dates the agencies and the peer-reviewed literature actually publish. Peak conception is not peak movement. Alabama’s Wildlife and Freshwater Fisheries division puts peak buck movement 7 to 10 days ahead of peak conception; Mississippi’s agency instructs hunters to subtract about two weeks. The two rules disagree, so this tool centers its rut curve 8 days ahead of the published conception date and displays the whole 7-to-14-day window rather than pretending to a single day.
| State | Published peak | What was measured | Method and sample | Source | Data years |
|---|---|---|---|---|---|
| Pennsylvania | November 13 | Median conception | Fetal aging, more than 6,000 road-killed does | PA Game Commission, When is the rut | 2000–2007 |
| Illinois (northern) | November 10 | Mean conception | Fetal crown-rump, 3,884 females / 4,781 fetuses, 15 counties | Green et al., Theriogenology (2017) | 2003–2013 |
| Wisconsin (southwest) | November 1–7 (movement); breeding Oct 23–Nov 12 | Peak buck movement | GPS collars, 188–319 collared males, hourly fixes | WI DNR Field Notes; USGS / Ecology and Evolution (2025) | 2017–2020 |
| Massachusetts | November 6–20 | Peak rut | Agency statement | MassWildlife | not stated |
| Maryland | First half of November | Conception | Agency statement | Maryland DNR, white-tailed deer biology | not stated |
| Oklahoma (eastern) | November 13 | Mean conception | Fetal crown-rump plus testes histology | Dunbar, Proc. Oklahoma Academy of Science 56 (1976); ODWC biologists say mid-November for central Oklahoma | pre-1976 |
| South Carolina | October 30 (average); 83% bred Oct 6–Nov 16 | Conception | Fetal aging, labeled “historic data” | SCDNR Deer Harvest Report | not stated by the agency |
| Texas | September 30 to December 24 by ecoregion — see below | Peak breeding | Fetal length, 2,436 does | Texas Parks and Wildlife, The Rut in White-tailed Deer | 3-year study, published 1996 |
| Georgia | October 13 to December 28 by county — see below | Peak rut activity | 45,811 deer-vehicle collisions, validated against conception data and GPS collars | GA DNR Wildlife Resources rut map; Stickles et al., J. SEAFWA (2015) | 2005–2012 |
| Alabama | Mid- to late January for most of the state; Dallas County average January 25 | Conception | Fetal collections and herd-health checks at 282 sites in 66 counties | Alabama DCNR / WFF | 1997–2019 |
| Mississippi | Late November in the northwest to mid-February in the southeast | Conception | Fetal aging, 20+ years of deer health checks | MSU Deer Lab; MDWFP breeding date map | 20+ years |
| Florida | July in extreme south Florida to early March in the northwest panhandle; northwest Florida mid-January through February | Conception | FWC deer breeding chronology study | Florida FWC | since 2009 |
| Louisiana | Varies by area — LDWF publishes a map, but the dates exist only inside the map graphic | Conception | Fetal measurement, statewide | Louisiana LDWF, estimated deer breeding periods | since 2006 |
| Indiana | “Primarily October and November” — no peak date published | — | Deer-vehicle collision analysis | Indiana DNR | to 2019 |
Texas, by ecoregion (Texas Parks and Wildlife, 2,436 does)
| Ecoregion | Peak breeding | Full range | Percent of does bred |
|---|---|---|---|
| Gulf Prairies and Marshes | September 30 (north); October 31 (south) | Aug 24 – Nov 25 | 92% |
| Post Oak Savannah | November 10–11 | Sep 30 – Jan 16 | 92% |
| Pineywoods | November 22 (north); November 12 (south) | Oct 21 – Jan 5 | 96% |
| Rolling Plains | December 3 (north); November 20 (south) | Oct 8 – Dec 30 | 97% |
| Edwards Plateau | November 7 (east); November 24 (central); December 5 (west) | Oct 9 – Jan 30 | 90% |
| Cross Timbers | November 15 (north); November 17 (south) | Oct 13 – Dec 17 | 95% |
| Trans-Pecos | December 8 | Nov 4 – Jan 4 | 81% |
| South Texas Plains | December 16 (east); December 24 (west) | Nov 9 – Feb 1 | 95% |
Georgia, by county band (GA DNR rut map)
Georgia’s map is built from deer-vehicle collisions, which the underlying study found to line up closely with both peak conception and peak GPS-collar movement — so unlike the conception-based states, Georgia’s published dates are already movement dates and this tool does not shift them. The spread inside one state is more than ten weeks.
| Band | Representative counties |
|---|---|
| October 13–19 | Ben Hill, Camden, Candler, Glynn, Jenkins, McIntosh, Telfair |
| October 20–26 | Atkinson, Brantley, Bryan, Bulloch, Burke, Charlton, Chatham, Clay, Clinch, Coffee, Columbia, Effingham, Emanuel, Evans, Glascock, Jefferson, Liberty, Long, McDuffie, Richmond, Screven, Ware |
| November 3–9 | Appling, Bartow, Bibb, Bleckley, Butts, Chattooga, Clayton, Cobb, DeKalb, Dodge, Dooly, Floyd, Greene, Hancock, Henry, Houston, Jones, Lamar, Laurens, Macon, Meriwether, Newton, Oglethorpe, Rockdale, Spalding, Upson, Walker, Walton, Wilkes |
| November 10–16 | Barrow, Carroll, Catoosa, Chattahoochee, Cherokee, Clarke, Coweta, Dade, Douglas, Fayette, Forsyth, Franklin, Fulton, Gilmer, Gwinnett, Hall, Harris, Heard, Jackson, Madison, Murray, Muscogee, Oconee, Pickens, Sumter, Talbot, Turner, Whitfield, Wilcox |
| November 24–30 | Baker, Banks, Calhoun, Dougherty, Habersham, Irwin, Lumpkin, Mitchell, Rabun, Stephens, Terrell, Thomas, Webster, White |
| December 1–7 | Quitman |
| December 8–14 | Decatur, Grady |
| December 15–21 | Early, Miller |
| December 22–28 | Seminole |
Counties the source PDF marked with fewer than 100 collisions carry low accuracy in the agency’s own words. Check the full 159-county map before you plan a trip around a band.
The states that publish nothing
This is the part nobody else will tell you. We went looking for agency-published breeding chronology in every state and could not find any for Michigan, Minnesota, Iowa, New York, Ohio, Kentucky, West Virginia, Virginia, Tennessee, Kansas, Nebraska, Missouri, the Dakotas or the Mountain West. Every “rut date” circulating for those states traces back to a magazine, an outfitter or a prediction site, not to a wildlife agency.
Two near-misses worth knowing. Arkansas Game and Fish publishes lactation rates by management unit but no conception dates. North Carolina’s published “2024 Deer Rut Dates Map” is, as issued, only a table of reproductive sample counts by county, with the agency’s own note that “additional samples are needed in some counties to increase precision/accuracy of estimated peak rut dates.” North Carolina’s dates are still being compiled.
For those states this tool gives you the time-of-day forecast and says so. We do not interpolate a rut date from a neighbouring state, because breeding chronology is not a smooth function of geography — Alabama and Mississippi vary by five to eight weeks inside a single state at nearly constant latitude, a difference their agencies attribute to mid-century restocking genetics from seven different source states.
Georgia peak rut dates by county
Georgia is the one state that publishes a peak-movement week for every county, so the tool offers all 159 by name rather than asking you which band you are in. The whole table is printed here as well, because a reader with JavaScript switched off and an AI assistant reading this page should both get the data.
| County | Published peak movement week |
|---|---|
| Appling | 11/03-11/09 |
| Atkinson | 10/20-10/26 |
| Bacon | 10/27-11/02 |
| Baker | 11/24-11/30 |
| Baldwin | 10/27-11/02 |
| Banks | 11/24-11/30 |
| Barrow | 11/10-11/16 |
| Bartow | 11/03-11/09 |
| Ben Hill | 10/13-10/19 |
| Berrien | 11/03-11/09 |
| Bibb | 11/03-11/09 |
| Bleckley | 11/03-11/09 |
| Brantley | 10/20-10/26 |
| Brooks | 11/17-11/23 |
| Bryan | 10/20-10/26 |
| Bulloch | 10/20-10/26 |
| Burke | 10/20-10/26 |
| Butts | 11/03-11/09 |
| Calhoun | 11/24-11/30 |
| Camden | 10/13-10/19 |
| Candler | 10/13-10/19 |
| Carroll | 11/10-11/16 |
| Catoosa | 11/10-11/16 |
| Charlton | 10/20-10/26 |
| Chatham | 10/20-10/26 |
| Chattahoochee | 11/10-11/16 |
| Chattooga | 11/03-11/09 |
| Cherokee | 11/10-11/16 |
| Clarke | 11/10-11/16 |
| Clay | 10/20-10/26 |
| Clayton | 11/03-11/09 |
| Clinch | 10/20-10/26 |
| Cobb | 11/03-11/09 |
| Coffee | 10/20-10/26 |
| Colquitt | 11/17-11/23 |
| Columbia | 10/20-10/26 |
| Cook | 11/17-11/23 |
| Coweta | 11/10-11/16 |
| Crawford | 11/03-11/09 |
| Crisp | 11/17-11/23 |
| Dade | 11/10-11/16 |
| Dawson | 11/17-11/23 |
| Decatur | 12/08-12/14 |
| DeKalb | 11/03-11/09 |
| Dodge | 11/03-11/09 |
| Dooly | 11/03-11/09 |
| Dougherty | 11/24-11/30 |
| Douglas | 11/10-11/16 |
| Early | 12/15-12/21 |
| Echols | 10/27-11/02 |
| Effingham | 10/20-10/26 |
| Elbert | 11/03-11/09 |
| Emanuel | 10/20-10/26 |
| Evans | 10/20-10/26 |
| Fannin | 11/17-11/23 |
| Fayette | 11/10-11/16 |
| Floyd | 11/03-11/09 |
| Forsyth | 11/10-11/16 |
| Franklin | 11/10-11/16 |
| Fulton | 11/10-11/16 |
| Gilmer | 11/10-11/16 |
| Glascock | 10/20-10/26 |
| Glynn | 10/13-10/19 |
| Gordon | 11/03-11/09 |
| Grady | 12/08-12/14 |
| Greene | 11/03-11/09 |
| Gwinnett | 11/10-11/16 |
| Habersham | 11/24-11/30 |
| Hall | 11/10-11/16 |
| Hancock | 11/03-11/09 |
| Haralson | 11/03-11/09 |
| Harris | 11/10-11/16 |
| Hart | 10/27-11/02 |
| Heard | 11/10-11/16 |
| Henry | 11/03-11/09 |
| Houston | 11/03-11/09 |
| Irwin | 11/24-11/30 |
| Jackson | 11/10-11/16 |
| Jasper | 10/27-11/02 |
| Jeff Davis | 11/03-11/09 |
| Jefferson | 10/20-10/26 |
| Jenkins | 10/13-10/19 |
| Johnson | 11/03-11/09 |
| Jones | 11/03-11/09 |
| Lamar | 11/03-11/09 |
| Lanier | 10/27-11/02 |
| Laurens | 11/03-11/09 |
| Lee | 11/17-11/23 |
| Liberty | 10/20-10/26 |
| Lincoln | 10/27-11/02 |
| Long | 10/20-10/26 |
| Lowndes | 11/03-11/09 |
| Lumpkin | 11/24-11/30 |
| Macon | 11/03-11/09 |
| Madison | 11/10-11/16 |
| Marion | 11/03-11/09 |
| McDuffie | 10/20-10/26 |
| McIntosh | 10/13-10/19 |
| Meriwether | 11/03-11/09 |
| Miller | 12/15-12/21 |
| Mitchell | 11/24-11/30 |
| Monroe | 10/27-11/02 |
| Montgomery | 11/03-11/09 |
| Morgan | 11/03-11/09 |
| Murray | 11/10-11/16 |
| Muscogee | 11/10-11/16 |
| Newton | 11/03-11/09 |
| Oconee | 11/10-11/16 |
| Oglethorpe | 11/03-11/09 |
| Paulding | 11/03-11/09 |
| Peach | 11/03-11/09 |
| Pickens | 11/10-11/16 |
| Pierce | 11/03-11/09 |
| Pike | 11/03-11/09 |
| Polk | 11/03-11/09 |
| Pulaski | 11/03-11/09 |
| Putnam | 10/27-11/02 |
| Quitman | 12/01-12/07 |
| Rabun | 11/24-11/30 |
| Randolph | 11/17-11/23 |
| Richmond | 10/20-10/26 |
| Rockdale | 11/03-11/09 |
| Schley | 10/27-11/02 |
| Screven | 10/20-10/26 |
| Seminole | 12/22-12/28 |
| Spalding | 11/03-11/09 |
| Stephens | 11/24-11/30 |
| Stewart | 11/17-11/23 |
| Sumter | 11/10-11/16 |
| Talbot | 11/10-11/16 |
| Taliaferro | 11/03-11/09 |
| Tattnall | 11/03-11/09 |
| Taylor | 10/27-11/02 |
| Telfair | 10/13-10/19 |
| Terrell | 11/24-11/30 |
| Thomas | 11/24-11/30 |
| Tift | 11/17-11/23 |
| Toombs | 11/03-11/09 |
| Towns | 11/17-11/23 |
| Treutlen | 11/03-11/09 |
| Troup | 11/10-11/16 |
| Turner | 11/10-11/16 |
| Twiggs | 11/03-11/09 |
| Union | 11/17-11/23 |
| Upson | 11/03-11/09 |
| Walker | 11/03-11/09 |
| Walton | 11/03-11/09 |
| Ware | 10/20-10/26 |
| Warren | 10/27-11/02 |
| Washington | 10/27-11/02 |
| Wayne | 11/03-11/09 |
| Webster | 11/24-11/30 |
| Wheeler | 11/03-11/09 |
| White | 11/24-11/30 |
| Whitfield | 11/10-11/16 |
| Wilcox | 11/10-11/16 |
| Wilkes | 11/03-11/09 |
| Wilkinson | 10/27-11/02 |
| Worth | 11/17-11/23 |
What GPS collars measured
| Finding | Number | Study |
|---|---|---|
| Buck movement, baseline vs peak rut | 269 → 409 yards per hour | MSU Deer Lab, 48 bucks, 15-minute fixes, 2 years, central Mississippi |
| Buck daytime bedding, baseline vs peak rut | 34% → 22% | MSU Deer Lab, same study |
| Doe movement, night vs daylight | about 200 vs under 165 feet per hour | Penn State Deer-Forest Study, hourly fixes, three PA state forests |
| Doe movement, full moon vs new moon | difference under 20 feet per hour | Penn State Deer-Forest Study, Diefenbach and Hepner |
| Buck bedding shift attributable to moon | about 7 minutes | MSU Extension P4068 |
| Buck daytime movement, food plots vs hardwood drains | 250 vs about 50 yards per hour | Stewart and Gulsby, Auburn University; 54 bucks, 57 does, 14,000-acre South Carolina property |
| Doe daytime movement, food plots vs hardwood drains | 150 vs about 75 yards per hour | Auburn University, same data set |
| Both sexes, all cover types, at night | 150 to 200 yards per hour | Auburn University, same data set |
| Buck movement by age class | 2-year-olds peak more than 10% higher than yearlings and than older bucks | WI DNR, 319 collared bucks |
| Firearm-season opening weekend effect on movement | no significant effect | USGS / Ecology and Evolution (2025), 188 collared males |
| Rut excursion distance | average 1.5 miles outside the home range | National Deer Association synthesis |
| Deer-vehicle collisions at dawn or dusk | at least 40% | Georgia DNR collision data |
The most actionable line in that table is the cover one. During daylight, bucks moved five times faster in hardwood drains and thick cover than in food plots, while does used food plots more than bucks did in daylight. If you are hunting a plot in the morning you are sitting where the daytime buck data is not.
Does the moon matter? What the tests found
| Claim | Test | Result |
|---|---|---|
| The moon shifts when the rut happens | Nine-year study of more than 1,600 does in New Brunswick; University of Georgia study of more than 2,500 does across several states | No correlation between peak breeding dates and moon phase |
| The “rutting moon” sets the date | PA Game Commission tested it against 8 years of conception data | Median conception stayed at November 13 every year while the moon drifted about 11 days a year |
| Moon phase changes how much deer move | Penn State, GPS-collared does, hourly fixes, two Octobers | Difference under 20 feet per hour. “Moon phase has an insignificant effect on deer movement.” |
| Moon position sets the best time of day | MSU Deer Lab, 48 bucks, 15-minute fixes, 2 years | “The moon position alone does not affect our bucks’ activity.” Combinations of phase and position: no effect. Bedding varied by about 7 minutes. |
| Perigee and apogee matter | MSU Deer Lab, same study | “No meaningful change.” |
| Older literature | Beier and McCullough (1990) and others | Actually split: two studies found no effect, two found increased full-moon movement. Penn State’s own review says so. |
Solunar theory, honestly
Solunar tables were put together by John Alden Knight in 1926 and first published as tables in 1936. They were a synthesis of fishing folklore and sun and moon positions — not a finding derived from animal-movement data, and not originally about deer at all.
They have been tested on GPS-collared deer twice, and the two studies disagree. Sullivan, Ditchkoff, Collier, Ruth and Raglin (2016), publishing in the Journal of the Southeastern Association of Fish and Wildlife Agencies, tracked 38 adult male deer at 30-minute fixes and found that activity around moonrise, moonset, overhead and underfoot did shift — but that the shift reversed sign depending on moon phase. Their own conclusion: “Our data suggest events identified by solunar charts have some association with deer activity. But the relationships between lunar events and lunar phase expressed in solunar charts may be misleading.” A larger, finer-grained study — MSU’s 48 bucks at 15-minute fixes — tested both solunar propositions and rejected both. Mississippi’s own agency describes the differences found as not enough to plan hunts around.
That is why this tool computes your major and minor solunar periods precisely and then leaves them out of the score. They are displayed in their own panel, with this paragraph attached. If a forecast sells you moon-based predictions without telling you this, it is selling you 1926.
Weather: the two effects with actual support
| Factor | What the GPS research found |
|---|---|
| Rain | Penn State: bucks reduced movement by as much as half on rainy days, unless the rain came with strong wind. This is the best-supported weather effect there is, and it points down. |
| Wind | Penn State: least movement in calm conditions, increasing steadily with wind speed — the opposite of what about 90% of readers expected. |
| Cold fronts | Penn State found no overall difference in speed or distance before, during or after a front. MSU’s 50 collared bucks peaked with the local rut, not with November fronts: “the lowest low in daily movement during the rut peak still exceeds the highest high prior to the rut.” |
| Temperature | Wisconsin DNR, 319 collared bucks: temperature did not significantly influence movement rates or range sizes; only calendar date and age class did. Auburn found two optimal temperatures with a trough between, and activity at every temperature. |
| Barometric pressure | The National Deer Association’s synthesis is direct: “No study has shown a strong or consistent correlation between deer movement rates and air temperature, barometric pressure, wind, rainfall, or the moon.” |
| Timing of the rut | Not weather-driven at all. Because a doe is only in estrus for 24 to 48 hours, bucks cannot wait for a cold front. |
This is why the tool does not ask for a weather forecast and then dress it up as a prediction. Rain suppresses; wind runs the way hunters do not expect; nothing else survived testing.
How this deer movement forecast is calculated
Transparent on purpose. Two published quantities do the work; the curve shapes are ours and are labeled as such.
STEP 1 - time of day (t = minutes after local midnight)
  dawn_peak(t) = 100 * exp( -(t - sunrise)^2 / (2 * 70^2) )
  dusk_peak(t) = 100 * exp( -(t - sunset)^2  / (2 * 80^2) )
  baseline(t)  = 36 when t is before civil dawn or after civil dusk
               = 30 in daylight
      (the 36:30 ratio is Penn State's measured 200 vs under-165 feet per hour,
       night vs daylight; the 70 and 80 minute widths are our modeling choice)
  base(t) = max( dawn_peak, dusk_peak, baseline )

STEP 2 - rut position (d = days from the published peak-movement date)
  rut(d) = 1 + 0.52 * exp( -d^2 / (2 * 10.5^2) )
      (0.52 is MSU's measured 269 -> 409 yards per hour, a 52% rise.
       10.5 days makes one standard deviation match the 21-day core
       breeding window MSU reports. Where a state publishes conception
       rather than movement, peak movement = conception date - 8 days,
       the midpoint of Alabama WFF's published 7-to-10-day lead.)
  rut(d) = 1.00 for states with no published breeding chronology

STEP 3 - index
  index(t) = 100 * base(t) * rut(d) / 152
      (152 = 100 * 1.52, so 100 on this scale is a peak-rut dawn.
       A dawn outside the rut scores about 66.)

NOT IN THE SCORE, and shown separately with the evidence:
  moon phase, moon position, solunar major and minor periods,
  temperature, barometric pressure, cold fronts.
Worked example, done by hand
ZIP 53703 (Madison, Wisconsin; 43.07°N, 89.38°W), November 4, 2026, Central Standard Time. Sunrise is 6:36 a.m. and sunset is 4:45 p.m. Wisconsin’s published peak buck movement is November 1–7, measured on 188 to 319 GPS-collared males, so the tool centers the curve on November 4 and d = 0. That makes rut(d) = 1.52, the maximum. At sunrise, base(t) = 100, so the index is 100 × 100 × 1.52 / 152 = 100. At noon, base(t) is the daylight baseline of 30 and the index is 30 × 1.52 / 152 = 30. Move the same location to December 20, which is 46 days past the peak: rut(d) drops to 1.00 and the dawn index falls to 66. The tool is telling you that a mid-December dawn in Wisconsin is worth about two thirds of a November 4 dawn — and that a November 4 noon is still worth less than a December 20 dawn.
Frequently asked questions
- Is a deer movement forecast the same as deer feeding times?
- They are sold as the same thing and they are not. Published deer feeding times come from solunar tables, which are built on moon position alone. This deer movement forecast scores time of day and your state’s published rut chronology, because those are the two factors GPS-collar studies actually found. We compute the solunar periods and show them further down the page, but they are deliberately left out of the score.
- What is the best time of day to hunt deer?
- Dawn and dusk, in every published data set, and the rut does not change that — it raises the whole curve rather than moving the peaks. Georgia’s collision data puts at least 40% of struck deer at dawn or dusk. Penn State measured does moving about 200 feet per hour at night against under 165 in daylight, which is why the hours right at the light transitions are where the night-time movement overlaps with legal shooting light.
- When is the rut in my state?
- If your state agency publishes breeding chronology, the date is in the table above with its method and data years, and this tool will use it. If it does not — and most states do not — the tool will tell you that plainly rather than making one up. Peak conception and peak movement are different things: buck movement runs 7 to 14 days ahead of conception depending on which agency’s rule you follow.
- Does the moon phase affect deer movement?
- Not measurably. Penn State’s GPS-collared does moved less than 20 feet per hour differently between new and full moon — about two body lengths. Mississippi State’s 48 collared bucks showed no effect from phase, no effect from moon position, no effect from the combination, and about a seven-minute shift in bedding time. Two studies from the 1990s did find a full-moon effect, so the older literature is actually split, but nothing modern supports planning around it.
- Does the moon change when the rut happens?
- No. The Pennsylvania Game Commission tested the “rutting moon” idea against eight years of conception data: the median conception date sat at November 13 every year while the moon’s phase drifted about eleven days annually. A nine-year New Brunswick study of 1,600 does and a University of Georgia study of 2,500 does found the same non-result. Photoperiod — day length, working through melatonin — sets the timing.
- Are solunar tables worth anything for deer?
- They were assembled in 1926 from fishing folklore, and they have been tested on collared deer twice with opposite results. The one study that found an association (Sullivan et al. 2016, 38 bucks) also found the effect flips direction depending on moon phase, which is exactly the interaction commercial charts do not model — so the charts can be pointing the wrong way about half the time. This tool computes your major and minor periods accurately and keeps them out of the score.
- Do cold fronts make deer move?
- Penn State found no overall difference in movement speed or distance before, during or after a front. Mississippi State’s collared bucks peaked with the local rut rather than with November fronts, and put it starkly: the lowest daily movement during peak rut still exceeded the highest before the rut. Rain is the weather variable with real support, and it points down — up to half the movement lost on a rainy day. Wind is the surprise: least movement in calm air, more as the wind picks up.
- What is the “second rut” and is it real?
- Real, and much smaller. A doe that is not bred cycles back into estrus in 21 to 30 days — Mississippi State says 21 to 30, Maryland DNR says about 28, Florida FWC says 26 to 28. That produces a secondary peak three to four weeks after the main one, made up of recycling adults plus doe fawns reaching breeding weight. It is a far bigger factor in Midwest agricultural country than in the Deep South: Pennsylvania records nearly half of all fawn breeding from December to February, while Mississippi breeds only about 10% of its fawns. This tool marks the window rather than scoring it, because no agency publishes a magnitude for it.
- Is “lockdown” a real phase?
- Not in the GPS data. Bucks wearing collars show no lockdown — they hold their highest movement rates of the year straight through and beyond peak breeding. What changes is your ability to see it: more than half of tending happens in darkness in November, and a tending pair moves into thick cover away from other deer while most hunters are watching food. The seven-phase model you see everywhere — pre-rut, seeking, chasing, peak, lockdown, post-rut, second rut — has no agency or peer-reviewed definition behind it. Only “tending” and the second rut survive contact with the literature.
Sources
- Download the underlying data: deer-breeding-and-movement-research-2026-08.csv — every breeding date, movement figure and study on this page with its source, method, sample size and data years. CC BY 4.0.
- Pennsylvania Game Commission, When is the rut — median conception November 13, the rutting-moon test, fawn breeding.
- Green, Kelly, Satterthwaite-Phillips, Manjerovic, Shelton, Novakofski, Mateus-Pinilla, Reproductive characteristics of female white-tailed deer in the Midwestern USA, Theriogenology (2017).
- Wisconsin DNR, Field Notes, December 2023, and USGS / Ecology and Evolution (2025), breeding season and movement ecology in southwest Wisconsin.
- Texas Parks and Wildlife, The Rut in White-tailed Deer — the ecoregion table.
- Georgia DNR Wildlife Resources, Georgia rut map, and Stickles et al., Using deer-vehicle collisions to map breeding activity in Georgia, J. SEAFWA (2015).
- Alabama WFF, The Alabama Rut and white-tailed deer — the 7-to-10-day movement lead and the restocking-genetics explanation.
- MSU Deer Lab, Ecology of the rut and Biology of the rut; MDWFP, deer breeding date map and moon myths vs deer reality.
- MSU Extension publication P4068, Lunar legends and deer activity — 48 collared bucks, the 269-to-409 yards-per-hour rut figure, the 83% hunter-belief survey.
- Penn State Deer-Forest Study, Wandering in the moonlight, The rut is half over, and its weather archive.
- Sullivan, Ditchkoff, Collier, Ruth and Raglin, Movement with the moon: white-tailed deer activity and solunar events, J. SEAFWA (2016).
- SCDNR, Deer Harvest Report; Maryland DNR, deer biology; MassWildlife, a closer look at deer breeding season; Indiana DNR, deer biology; Florida FWC, white-tailed deer; Louisiana LDWF, estimated deer breeding periods.
- National Deer Association: what deer research really says about the rut, hunting cold fronts, does weather impact deer movement, GPS-collar research on daylight movement, why bucks vanish when tending does.
- Location data: US Census Bureau 2024 ZCTA Gazetteer (coordinates) and the 2020 ZCTA-to-county relationship file (state assignment), aggregated by us to three-digit ZIP prefix.
Related on Popular Outdoorsman
This page is authoritative on when deer are likely to be on their feet. The three things it openly cannot see are food, pressure and the deer on your own property. For food, see what to plant in July for fall. For the deer themselves, see patterning summer bucks on trail camera, and the 2026 trail camera rankings if you still need one in the woods.
Reader Favorites
Field-to-table reference desk
From tag to table — official season dates for all 50 states, plus safe doneness temps for your harvest.
| Species | Archery | Firearm |
|---|---|---|
| Deer | Sep–Oct | Nov |
| Elk | Sep | Oct–Nov |
| Turkey | — | Apr–May |
All 50 state wildlife agencies, plus how seasons, tags and licenses work.
Find your state → Network| Doneness | Target |
|---|---|
| Rare | 125–130°F |
| Medium-rare | 130–135°F |
| Well-done | 160°F+ |
Safe pull temps for venison and steak, from Popular BBQ.
View full chart →