Best Fishing Times by ZIP: Solunar Calculator
The best fishing times for your ZIP code and date, calculated from where the sun actually sits in the sky at your location rather than from moon phase alone.
Last updated: September 22, 2026 · Originally published September 15, 2026
Enter a ZIP code and a date and this page gives you the hours a fish is most likely to eat, calculated from where the sun actually sits in the sky at your location. It also computes your solunar major and minor periods to the minute — and then tells you honestly that it left them out of the score, because the only peer-reviewed head-to-head test of commercial solunar tables found they do not predict catch.
A short daily brief for hunters and anglers. Your results stay on screen either way. Unsubscribe in one click.
How these best fishing times are calculated
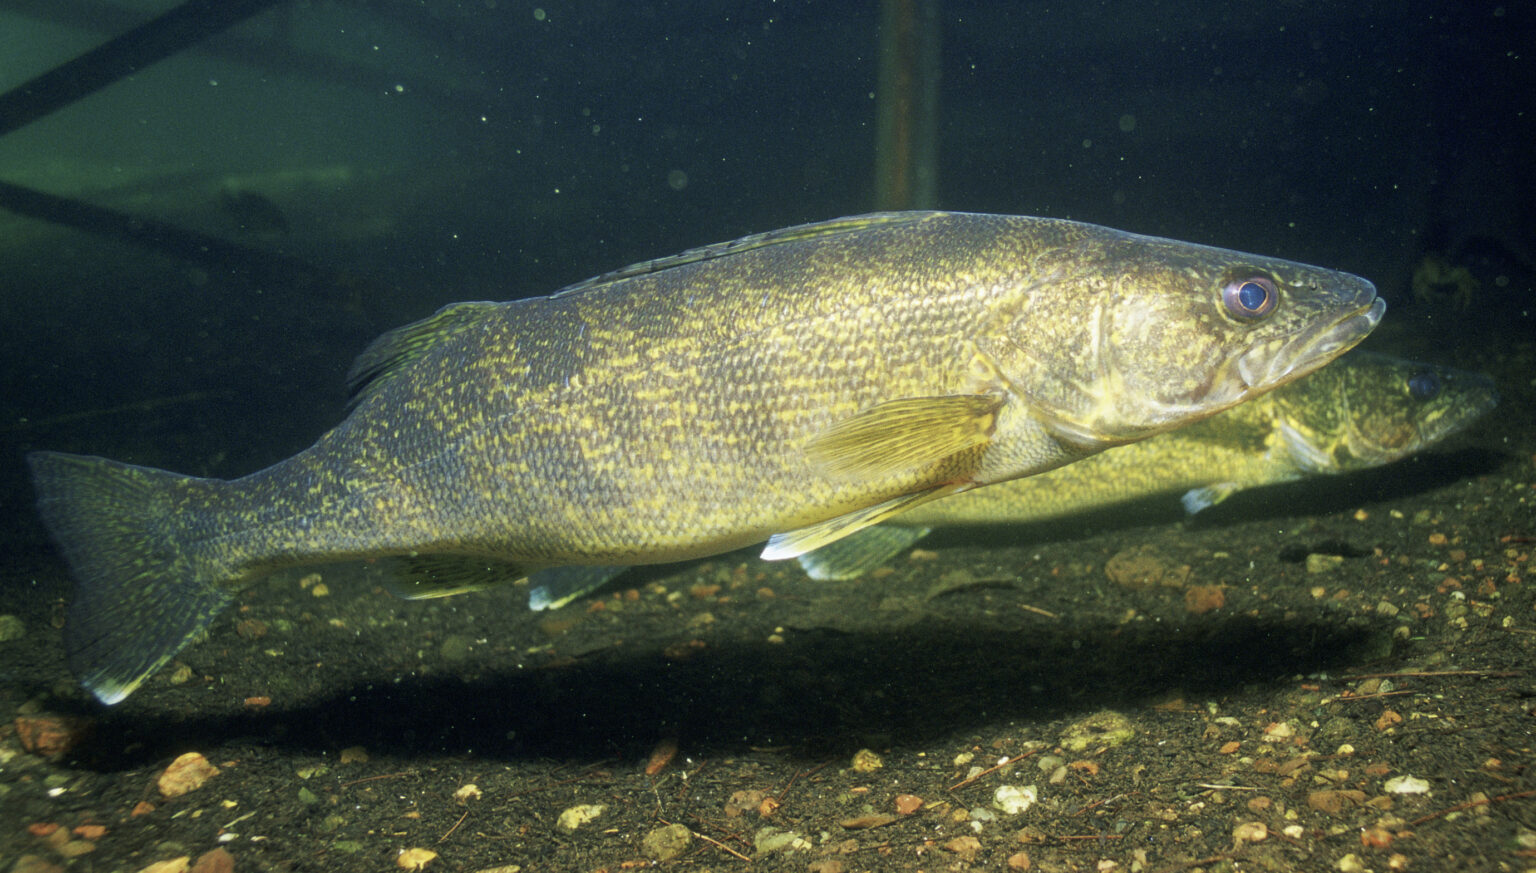
The index is built from one measured effect, and only that effect. In laboratory trials reported by Michels and colleagues in Environmental Biology of Fishes (2025), walleye prey-capture success averaged 20.5% in the narrow twilight light band running from nautical twilight to roughly three degrees below the horizon (0.05 to 1 lux), and fell to 10 to 12% both in brighter light and in full darkness. That is roughly a 1.9-fold advantage confined to a band that lasts, on average across our ten test cities, 102 minutes a day split between morning and evening.
So the tool computes exactly that band and scores against it. The plain-text formula:
prime band = the clock times when the sun sits between 12 degrees and 3 degrees below the horizon (morning and evening)inside a prime band: index = 100outside: index = max(54, 100 * exp(-(d * d) / (2 * 45 * 45)))where d = minutes to the nearest edge of the nearest prime band
Two constants deserve to be defended rather than buried. The floor of 54 is not arbitrary: 100 divided by 54 gives 1.85, which reproduces the measured 20.5-versus-11 percent capture ratio, so the tool never claims a bigger day-night swing than the study measured. The 45-minute shoulder is a smoothing choice, not a measured value — it exists so the index does not fall off a cliff the second the sun clears three degrees, and we disclose it here so you can judge it. Nothing else enters the score. No moon phase, no moon position, no barometric pressure.
Worked example, done by hand
Kansas City, Missouri — ZIP 64108, which resolves to the 641 prefix centroid at 39.14 N, 94.57 W — on 15 September 2026, UTC offset -5. Type those inputs into the tool above and you will get these numbers back:
- Nautical dawn (sun at -12 degrees): 6:01 a.m. → prime band ends (sun at -3 degrees): 6:48 a.m.
- Sunrise 7:00 a.m., sunset 7:26 p.m.
- Evening prime band (sun at -3 degrees): 7:38 p.m. → nautical dusk (-12 degrees): 8:25 p.m. — 94 minutes of prime light across the two bands.
- Applying the formula, the index holds at or above 90 from 5:40 to 7:10 a.m. and from 7:20 to 8:50 p.m. Those are the day’s two windows: each prime band plus the shoulder either side of it.
- The same day’s solunar majors fall at 4:20 a.m. (moon underfoot) and 4:44 p.m. (moon overhead). Neither one touches either prime band. A solunar app would have sent you out at a quarter to five in the afternoon.


Solunar periods: computed exactly, deliberately unscored
The tool still calculates your major periods (the two hours centered on the moon’s upper and lower transit) and minor periods (the hour centered on moonrise and moonset), to the minute, because people want to see them. They are displayed in their own panel, in purple, outside the index. Here is why.
| Test | Design | Result |
|---|---|---|
| Quigley, Gonzalez Murcia and Kauwe (2023), SN Applied Sciences 5:161 | 361 fishing trips over 221 days, 1,355.2 angling hours, Utah trout waters, Sept 2013 to Feb 2019. Tested daily ratings from seven commercial solunar services against catch per hour, with Bonferroni correction. | “no significant relationship was found between CPUE and any of the solunar values tested, lunar phase, or lunar illumination.” Air temperature beat every solunar table tested. |
| Hanson and colleagues (2008), Fisheries Management and Ecology 15:357-364 | 22 largemouth bass tagged with acoustic transmitters, whole-lake 3-D telemetry, Warner Lake Ontario, six complete lunar cycles Nov 2004 to Sept 2005. | “solunar tables frequently consulted by recreational anglers may have little predictive value for identifying peak fishing time.” No repeatable lunar effect on activity. |
| Sieh and Parsons (1950), Proc. Iowa Acad. Sci. 57:511-518 | The original test of Knight’s own tables, Clear Lake, Iowa, gill-net catch. | No correlation between gill-net catch per unit effort and peak solunar times. Reported as characterised by Quigley et al. 2023; we could not retrieve the 1950 original. |
| Vinson and Angradi (2014), PLOS ONE 9:e98046 | 341,959 muskellunge angling records, North America, 1970 to 2013 — the largest freshwater dataset on this question. | A real 29-day lunar signal exists, but “The predicted maximum relative effect was approximately 5% overall,” and the authors note angler effort itself cycles with the moon, so they “could therefore not conclude that the lunar effect on catch was due to an effect on fish behavior alone.” |
| Stevenson and Millar (2013), Environmental and Ecological Statistics 20:591-608 | New Zealand snapper, two recreational datasets, controlling for season, fisher, effort and biomass. | Found small real lunar effects, then concluded: “The magnitudes of these effects are small, but casting doubt on the practical relevance of lunar based fishing predictions.” |
| Pulver (2017), N. Am. J. Fish. Manage. 37:536-549 | Gulf of Mexico reef fish, observer data, two independent statistical methods. | Lunar effect found for red grouper and tilefish — and in opposite directions (red grouper near new moon, tilefish near full). No effect for yellowedge grouper, red snapper or vermilion snapper. |
| Poisson and colleagues (2010), Fishery Bulletin 108:268-281 | 2,009 pelagic longline sets, Reunion Island, 1998 to 2000, hook timers and time-depth recorders. | “Swordfish catch-per unit of effort (CPUE) increased during the first and last quarter of the lunar phase, whereas albacore CPUE was highest during the full moon.” Two species, same gear, same water, opposite best days. |
Read that table as a whole and the honest summary is this. Lunar periodicity in fish is real but species-specific, directionally inconsistent, and small where anyone has quantified it. What does not survive contact with data is the specific claim solunar tables make: that the moon’s position sets a predictable best hour of the day, the same way, for every species, everywhere. That claim has been tested twice and failed twice, most recently against seven commercial services at once.
Where solunar tables came from
John Alden Knight published the solunar theory in The Modern Angler: Including the Solunar Theory (Charles Scribner’s Sons, 1936). He proposed two major daily peaks, when the moon is directly overhead and directly underfoot, and two minor peaks around moonrise and moonset, reasoning by analogy to marine tides — that inland waters experience something like a tide. It was a synthesis of angling folklore and lunar geometry, not a finding derived from fish-activity data. We deliberately do not repeat the widely circulated claims that Knight originated the idea in 1926 or that he screened “33 factors”; we could not trace either to a primary source, so we leave them out.
What actually predicts whether fish eat
| Factor | Support | What the evidence says |
|---|---|---|
| Water temperature | Strong — the dominant driver | Fish are ectotherms, so metabolic rate, digestion and appetite track water temperature. In the one head-to-head test, temperature outperformed every solunar table: “Temperature alone was a better predictor of fishing success than any of the available free or premium solunar tables” (Quigley et al. 2023). Enter a water temperature above and the tool reads it against the published range for your species. |
| Light level (dawn and dusk) | Strong — and quantified | Walleye prey-capture success 20.5% in the 0.05 to 1 lux twilight band versus 10 to 12% in brighter light and in full darkness (Michels et al. 2025). Field stomach-content data agree: walleye consumption peaks from late night to mid-morning and drops at midday (Maule and Horton 1984, 425 stomachs, Columbia River). This is the effect the index is built on. |
| Season and spawning | Strong | Largemouth bass daily movement was five times greater in spring and summer than in winter (Hanson et al. 2008). Spawning temperature triggers are well published per species — see the table below. |
| Moon phase and position | Weak, species-specific, inconsistent | See the test table above. Around 5% maximum where measured, and confounded with when anglers choose to fish. |
| Barometric pressure | No verified support found | This is the single largest piece of fishing folklore and we could not locate one peer-reviewed study, state agency page or university extension publication measuring barometric pressure against catch or feeding activity. Every source we found was a blog, a tackle retailer or a content farm. The 2023 solunar study tested wind speed and air temperature, not pressure. The tool therefore publishes no barometric rule at all rather than dress up folklore as a forecast. If you know of a primary source, we want it. |
| Wind | Not supported in the one study that tested it | Quigley et al. 2023 included wind speed and found no significant relationship with trout catch per hour. That is one study on one species group; treat it as unresolved rather than disproved. |
Dawn and dusk are not interchangeable
Accelerometer tags on 37 fish in Toronto Harbour over two years found that largemouth bass acceleration peaked at dawn (0.521 plus or minus 0.012 m/s squared) and declined through the day, while northern pike peaked at dusk (0.212) ahead of dawn (0.178), both species lowest during the middle of the day and at night (Hlina et al., Animal Biotelemetry, 2026). The index treats the two twilights symmetrically because we have a published dawn-versus-dusk ratio for pike and not for bass, and we would rather flag the asymmetry than invent a number for it. Pick a species above and the tool tells you which twilight the literature favours.
Water temperature reference table
Every figure below is quoted from a state wildlife agency, a federal agency, or a university extension publication, with the source named. Blank cells are blank on purpose: we could not find the value in a source that meets that bar, and we would rather show you the gap than fill it with a number from a blog.
| Species | Preferred / optimal temperature | Spawning trigger | Source |
|---|---|---|---|
| Largemouth bass | 75 to 86 °F (conv. from 24 to 30 °C) | 60 to 70 °F (conv.); nest selection at 60 °F, eggs laid 62 to 65 °F | Louisiana CPRA Largemouth Bass HSI (2016 rev.); Wisconsin DNR |
| Smallmouth bass | — | 62 to 64 °F typical, documented as low as 53 °F | Wisconsin DNR; Iowa DNR |
| Walleye | 72 to 75 °F † | 42 to 50 °F at peak; migration begins 38 to 44 °F | Minnesota DNR; Wisconsin DNR; † US NRC Fermi 3 ER (2011) |
| Yellow perch | — | 45 to 52 °F | Wisconsin DNR |
| Black crappie | 73 to 90 °F † | 64 to 68 °F | Wisconsin DNR; † US NRC Fermi 3 ER (2011) |
| Bluegill | about 81 °F † | 67 to 80 °F | Wisconsin DNR; † US NRC Fermi 3 ER (2011) |
| Channel catfish | about 85 °F for optimum growth | 75 to 85 °F, optimum about 80 °F | SRAC Publication 180, Southern Regional Aquaculture Center / Texas A and M Extension (1988) |
| Northern pike | 60 to 65 °F | 34 to 40 °F (WI), preferred 36 to 37 °F; MN states 40 to 50 °F — agencies disagree | Minnesota DNR; Wisconsin DNR |
| Muskellunge | — | 49 to 60 °F, optimum about 55 °F | Wisconsin DNR |
| Rainbow trout | 55.6 to 66.2 °F optimum growth (conv. from 13.1 to 19.0 °C) | — | Nevada DEP Rainbow Trout Thermal Tolerance Analysis (2015 draft) |
| Brown trout | 55.0 to 66.2 °F optimum growth (conv.) ‡ | — | Nevada DEP Brown Trout Thermal Tolerance Analysis (2017) |
| Brook trout | 54.3 to 60.8 °F optimum growth (conv.); does not tolerate above about 65 °F | — | Nevada DEP Brook Trout TTA (2017); Wisconsin DNR; US National Park Service |
| Striped bass | 75 to 82 °F smaller juveniles, about 68 °F larger fish (conv.); habitat compresses above 77 to 82 °F | 54 to 66 °F (conv.); active spawning from about 55 °F | NOAA Striped Bass Literature Review; Virginia DWR |
| White bass | — | 50 to 55 °F | Oklahoma Department of Wildlife Conservation |
† These four optimum figures come from a US Nuclear Regulatory Commission environmental report, which is a federal agency document, but it attributes them to an internal reference we could not resolve. Treat them as indicative, not authoritative. ‡ Wisconsin DNR publishes a preferred range of 65 to 75 °F for brown trout, which sits above Nevada DEP’s optimum-growth range and above its own chronic threshold. Both cannot be right; we show the laboratory-derived figure and flag the conflict rather than pick silently. Our next data pass targets Great Lakes Fishery Commission Special Publication 87-3 (Wismer and Christie, 1987), which should close most of the blank cells above.
The solunar-versus-light dataset
The headline figure at the top of this page is computed, not asserted, and you can check it. For each of ten US cities we generated every day of 2027, computed the moon’s upper and lower transit, drew a two-hour major period around each, computed the prime light band from solar altitude, and tested for overlap. Minor periods use a one-hour window around moonrise and moonset.
| City | Latitude | Major periods in prime light |
|---|---|---|
| Minneapolis, MN | 44.98 N | 24.3% |
| Bangor, ME | 44.80 N | 24.1% |
| Portland, OR | 45.52 N | 24.0% |
| Buffalo, NY | 42.89 N | 23.7% |
| Nashville, TN | 36.16 N | 23.5% |
| Kansas City, MO | 39.10 N | 23.4% |
| Phoenix, AZ | 33.45 N | 23.3% |
| Denver, CO | 39.74 N | 23.1% |
| Houston, TX | 29.76 N | 23.0% |
| Orlando, FL | 28.54 N | 22.6% |
| All ten cities | 3,650 days | 23.5% of 7,050 majors; 17.2% of 7,060 minors |
The remarkable thing is how flat that column is. From Orlando to Bangor, across sixteen degrees of latitude, the agreement rate never leaves the 22.6 to 24.3 percent band — because the two systems are keyed to different clocks entirely. Solar twilight is locked to the solar day; lunar transit drifts about fifty minutes later every day. They coincide at roughly the rate chance predicts, which is the whole point.
How to read your best fishing times
- An index of 100 means the sun is inside the measured prime band. That is the strongest claim this tool makes, and it is about light, not about fish being hungry on command.
- The floor of 54 is not “bad fishing.” It is the middle of the day and the middle of the night, where the laboratory data put capture success at 10 to 12 percent instead of 20.5. Plenty of fish are caught at noon.
- Water temperature outranks everything on this page. If the water is 48 degrees and you are chasing largemouth bass, the prettiest twilight in the world will not fix it. Enter a temperature and read that panel first.
- The purple solunar panel is provided, not endorsed. If your major period happens to land inside a prime band, the tool says so — that happens about 23.5% of the time, and on those days the two systems agree by coincidence rather than by mechanism.
- This is a light and timing tool, not a fishing report. It knows nothing about your water, your bait, recent stocking, flow, or whether anyone has caught anything there since March.
Frequently asked questions
Do solunar tables work?
The only published head-to-head test found they do not. Quigley and colleagues (2023) measured 361 fishing trips and 1,355.2 angling hours against the daily ratings of seven commercial solunar services and reported no significant relationship between any solunar value and catch per hour. An earlier test of Knight’s original tables in 1950 also found nothing. Whole-lake telemetry on largemouth bass reached the same conclusion in 2008.
So why does this page calculate them at all?
Because you asked for them, they are cheap to compute exactly, and hiding them would be its own kind of dishonesty. They are shown in a separate panel, in purple, clearly outside the score, with this evidence attached. Every other free solunar tool shows you the periods and stops there.
What is the “prime light band”?
The clock times when the sun sits between 12 and 3 degrees below the horizon — roughly nautical twilight through to just before sunrise, and just after sunset through to nautical dusk. That range corresponds to the 0.05 to 1 lux band in which walleye prey-capture success was measured highest. It averages 102 minutes a day across our ten test cities, split between morning and evening, and it is longer in summer and at high latitude.
Does the moon matter for fishing at all?
Sometimes, for some species, in different directions. Muskellunge catch shows a real 29-day signal worth about 5 percent at maximum across 341,959 records. Gulf red grouper peak near the new moon while tilefish peak near the full. Swordfish peak at the quarters while albacore peak at the full. Lunar spawning rhythms are actually real in many fishes. None of that supports a daily best-hour prediction, which is the specific thing solunar tables sell.
Why is there no barometric pressure input?
Because we went looking for the evidence and did not find any. Not one peer-reviewed paper, agency page or extension publication we could locate measured barometric pressure against fish catch or feeding. The claim is everywhere in fishing media and nowhere in the literature we could reach. Rather than add an input that would make the tool feel more scientific while being less so, we left it out and told you why.
What time zone should I choose?
The UTC offset actually in force on your date. The tool does not apply daylight saving for you, because the offset is the unambiguous input and the rules change. In the continental US that is -4 Eastern, -5 Central, -6 Mountain or -7 Pacific during daylight saving, and one hour further from zero in winter.
How accurate are the sun and moon times?
They were validated against published US Naval Observatory times for four locations across four dates. Of 32 event times compared, 30 matched exactly and two differed by one minute at the half-minute rounding boundary. ZIP codes resolve to the land-area-weighted centroid of their three-digit prefix, so a large prefix can shift your times by a few minutes; enter latitude and longitude directly for exact results.
Can I put this on my own site?
Yes, free, with the credit line. Use the Embed button under the results. The snippet includes a visible attribution link below the frame, which is the part that matters to both of us.
Sources
- Quigley, C.N., Gonzalez Murcia, J.D. and Kauwe, J.S.K. (2023). Popular solunar tables fail to predict fishing success in North American recreational freshwater trout fisheries. SN Applied Sciences 5:161.
- Hanson, K.C. et al. (2008). Effects of lunar cycles on the activity patterns and depth use of a temperate sport fish, the largemouth bass. Fisheries Management and Ecology 15:357-364.
- Vinson, M.R. and Angradi, T.R. (2014). Muskie lunacy: does the lunar cycle influence angler catch of muskellunge? PLOS ONE 9:e98046.
- Stevenson, B.C. and Millar, R.B. (2013). Promising the moon? Environmental and Ecological Statistics 20:591-608.
- Pulver, J.R. (2017). Does the lunar cycle affect reef fish catch rates? North American Journal of Fisheries Management 37:536-549.
- Poisson, F. et al. (2010). Effects of lunar cycle and fishing operations on longline-caught pelagic fish. Fishery Bulletin 108:268-281.
- Andrzejaczek, S. et al. (2025). Lunar cycle effects on pelagic predators and fisheries. Reviews in Fish Biology and Fisheries 35:77-94.
- Michels, N.O. et al. (2025). Visual sensitivity, foraging behavior, and success of walleye under ecologically relevant downwelling light conditions. Environmental Biology of Fishes 108:147-160.
- Hlina, B.L. et al. (2026). Seasonal effects on the acceleration of largemouth bass and northern pike in Toronto harbour. Animal Biotelemetry 14:5.
- Maule, A.G. and Horton, H.F. (1984). Feeding ecology of walleye in the mid-Columbia River. Fishery Bulletin 82:411-418.
- Knight, J.A. (1936). The Modern Angler: Including the Solunar Theory. Charles Scribner’s Sons.
- Wellborn, T.L. (1988). Channel catfish: life history and biology. SRAC Publication 180, Southern Regional Aquaculture Center.
- Nevada Division of Environmental Protection thermal tolerance analyses for rainbow (2015), brown (2017) and brook trout (2017).
- NOAA. Striped bass (Morone saxatilis) literature review on environmental influences on stock dynamics.
- Louisiana Coastal Protection and Restoration Authority, Largemouth Bass Habitat Suitability Index, 2016 revision.
- State agency species pages: Wisconsin DNR, Minnesota DNR, Iowa DNR, Virginia DWR, Oklahoma Department of Wildlife Conservation, Maine IFW, US National Park Service.
- US Naval Observatory Astronomical Applications Department, rise/set/transit/twilight data, used for engine validation.
- US Census Bureau 2024 ZCTA Gazetteer and 2020 ZCTA-to-county relationship file, used for ZIP prefix centroids.
Data updated August 2026. Sun and moon mathematics never stale. The species temperature table and the evidence review are re-checked annually each August, or sooner if a new controlled test of solunar tables is published. Known gaps are listed openly in the temperature table above.
Related on Popular Outdoorsman
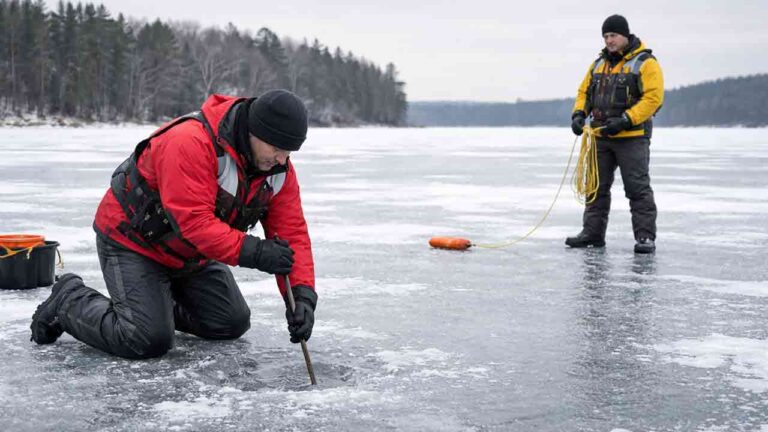
This page is authoritative on when to fish: the sun, moon and water-temperature windows for one day in one place. It does not tell you how to fish them. For the late-spring window this table keeps pointing at, see post-spawn walleye and smallmouth in late May. For reaching a prime-light window quietly, see the 2026 fishing kayak rankings. Before you fish a cold-water window, read winter fishing safety: a good solunar window is never a reason to be on bad ice.


Reader Favorites
Field-to-table reference desk
From tag to table — official season dates for all 50 states, plus safe doneness temps for your harvest.
| Species | Archery | Firearm |
|---|---|---|
| Deer | Sep–Oct | Nov |
| Elk | Sep | Oct–Nov |
| Turkey | — | Apr–May |
All 50 state wildlife agencies, plus how seasons, tags and licenses work.
Find your state → Network| Doneness | Target |
|---|---|
| Rare | 125–130°F |
| Medium-rare | 130–135°F |
| Well-done | 160°F+ |
Safe pull temps for venison and steak, from Popular BBQ.
View full chart →